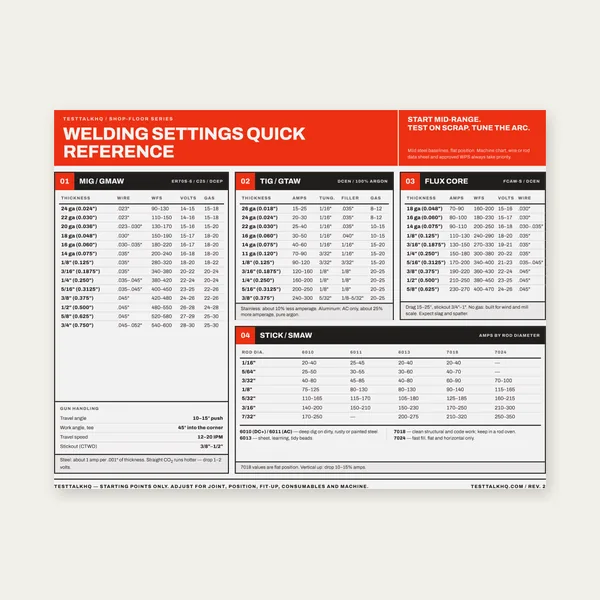
Welding Reference Card
One page. MIG, TIG, stick and flux core settings by thickness.
$3.99
BuyWhen the calculator’s lbs/hr looks fine — but the spool, stubs, or schedule disagree
Use this when the Weld Deposition Rate Calculator and shop reality diverge. Formulas, process charts, and ways to raise deposition live in the Deposition Rate Guide. Choosing weight vs length vs volume estimating methods is already covered in Electrode Consumption Estimating Methods. Spool overrun diagnosis: Wire Consumption Troubleshooting.

Most “calculator said 9 lbs/hr but we only put down 4” surprises come from confusing melt-off with deposition, entering the wrong wire diameter or WFS units, ignoring efficiency (especially Stick), measuring during feed problems, or treating shift output as if arc-on time were 100%.
| Symptom | What it usually means | First fix | Next tool |
|---|---|---|---|
| Spool loses more lbs than calculator deposits | You compared melt-off to deposition (or efficiency too high) | Apply process efficiency; weigh stubs/slag if Stick | Deposition Calculator |
| Displayed WFS “matches” but weigh-back is low | Wrong diameter, IPM vs m/min mix, or feed slip | Caliper wire; measure true IPM; fix liner/tip | WFS Guide |
| Shift lbs tiny vs hourly rate | Arc-on time treated as 100% | Multiply by real arc-on % (often 20–35%) | Cost Calculator |
| TIG “deposition” jumps job to job | Cold-wire IPM unknown or filler dips not timed | Time filler inches/min or weigh rod used | Guide |
| FCAW chart rate, solid-wire reality | Process/efficiency mismatch | Select FCAW vs GMAW correctly; re-run | Flux-Core Calculator |
What it looks like: Spool weigh-back shows 10 lbs/hr used. The calculator (or a brochure) said ~9.5 lbs/hr deposition and you call it a match — then inspection finds less weld metal than expected, or cost models underbuy wire.
Likely causes: Melt-off is wire leaving the spool. Deposition is metal that becomes weld. Spatter, stub loss, and slag are the gap. MIG efficiency is high (~92–98%); Stick is not (~65–75%).
Fixes: Enter the correct process efficiency in the calculator. For audits: deposition ≈ melt-off × efficiency. Guide depth: actual vs theoretical.
What it looks like: Math is clean; weigh-back is ~40–60% off. Or aluminum jobs look impossibly light/heavy.
Likely causes: Diameter enters as area (πr²) — 0.035 vs 0.045 is a huge swing. Machine displays sometimes in metric. Aluminum density (~0.098) vs steel (~0.283) must match the wire, not the base metal story you tell yourself.
Fixes: Mic the wire. Confirm IPM with a timed mark on the wire if the display is suspect. Pick the right density in the calculator. Then re-weigh a 5-minute arc coupon.
What it looks like: Panel WFS is “correct,” arc sounds rough, burnback or bird-nesting, and weigh-back undershoots the formula.
Likely causes: Slippage and restriction mean less wire actually melts than the setpoint implies. Contact tip wear and wrong liner size are classic.
Fixes: Replace tip/liner sized to the wire; set drive-roll tension for the wire type (knurled for flux-core). Re-time a weigh test only after feed is stable. Consumable overrun patterns: Wire Consumption Troubleshooting.
What it looks like: “We should deposit 80 lbs per shift” from an 10 lbs/hr rate × 8 hours. Actuals are ~20 lbs.
Likely causes: Deposition rate is an arc-on rate. Manual shops often run 20–35% arc-on. The calculator page and guide both stress this — missed in job planning anyway.
Fixes: Shift deposit ≈ lbs/hr × hours × arc-on fraction. For bidding, push the honest OF into the Weld Cost Calculator (see also Cost Troubleshooting).
What it looks like: Rods per joint estimate looks fine; stub buckets fill up and purchased lbs runaway.
Likely causes: SMAW deposition must include stub discard and coating/slag loss. Treating rod weight as deposited metal overstates productivity.
Fixes: Weigh stubs for a timed window; use 65–75% efficiency unless your procedure proves better. Estimating-method choice (weight vs length vs volume): Which Estimating Method.
What it looks like: Chart “spray transfer” rates entered while the job is short-circuit on thin sheet — or solid-wire efficiency used on FCAW.
Likely causes: Deposition capability changes with transfer mode and cored vs solid wire. Wrong process defaults in the calculator poison both productivity and cost.
Fixes: Match process and typical efficiency. For productivity levers (diameter, WFS, process choice), use the guide’s 5 ways to increase deposition — don’t invent a parallel technique page.
Article 3 SKIPPED: Weight vs length vs weld-volume estimating forks already live in Electrode Consumption Estimating Methods. Productivity levers and actual vs theoretical deposition are in the Deposition Rate Guide.
Chart SKIPPED: Complete process deposition charts already live in the guide (complete deposition rate charts) and process comparison tables on the calculator page. No unique 400+ word chart dataset beyond those.
One page. MIG, TIG, stick and flux core settings by thickness.
$3.99
Buy
19 pages. Four processes, stainless and aluminum, symbols and inspection.
$12.99
Buy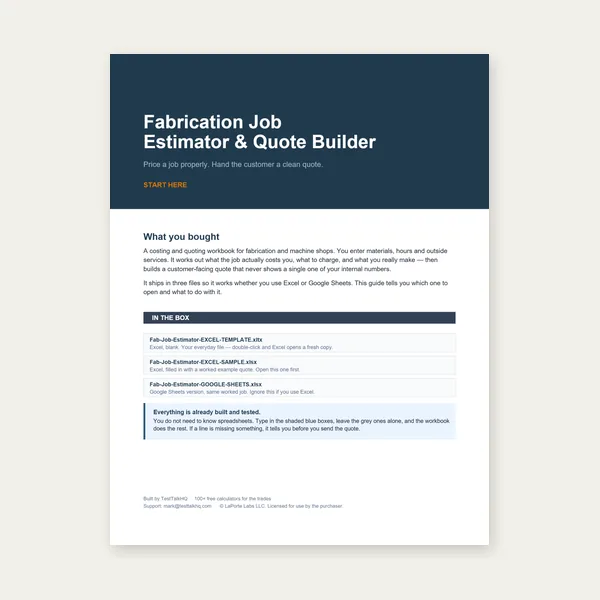
Price the job, then hand over a quote with no internal numbers.
Excel or Google Sheets. Best on a computer.
$29.00
Buy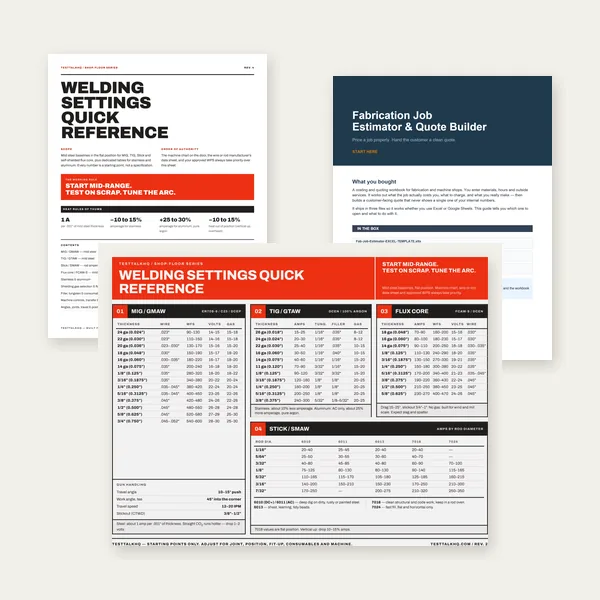
Card, 19-page guide and the estimator workbook. All six files.
Excel or Google Sheets. Best on a computer.
$34.99
$45.98 if bought separately — save $10.99
BuyCheckout opens in a new tab.
Five CSV catalog picks with verified Product Image URLs — weigh wire, keep feed stable, and match the diameter you calculate.
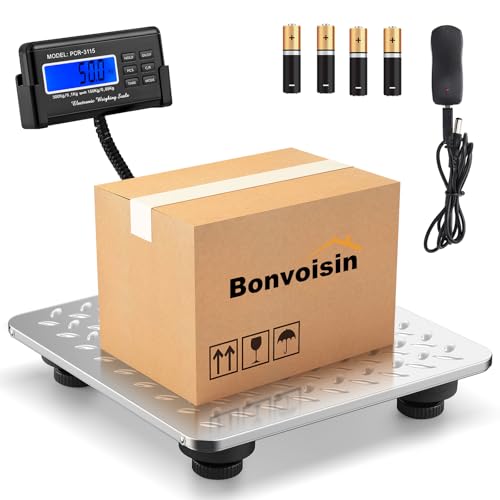
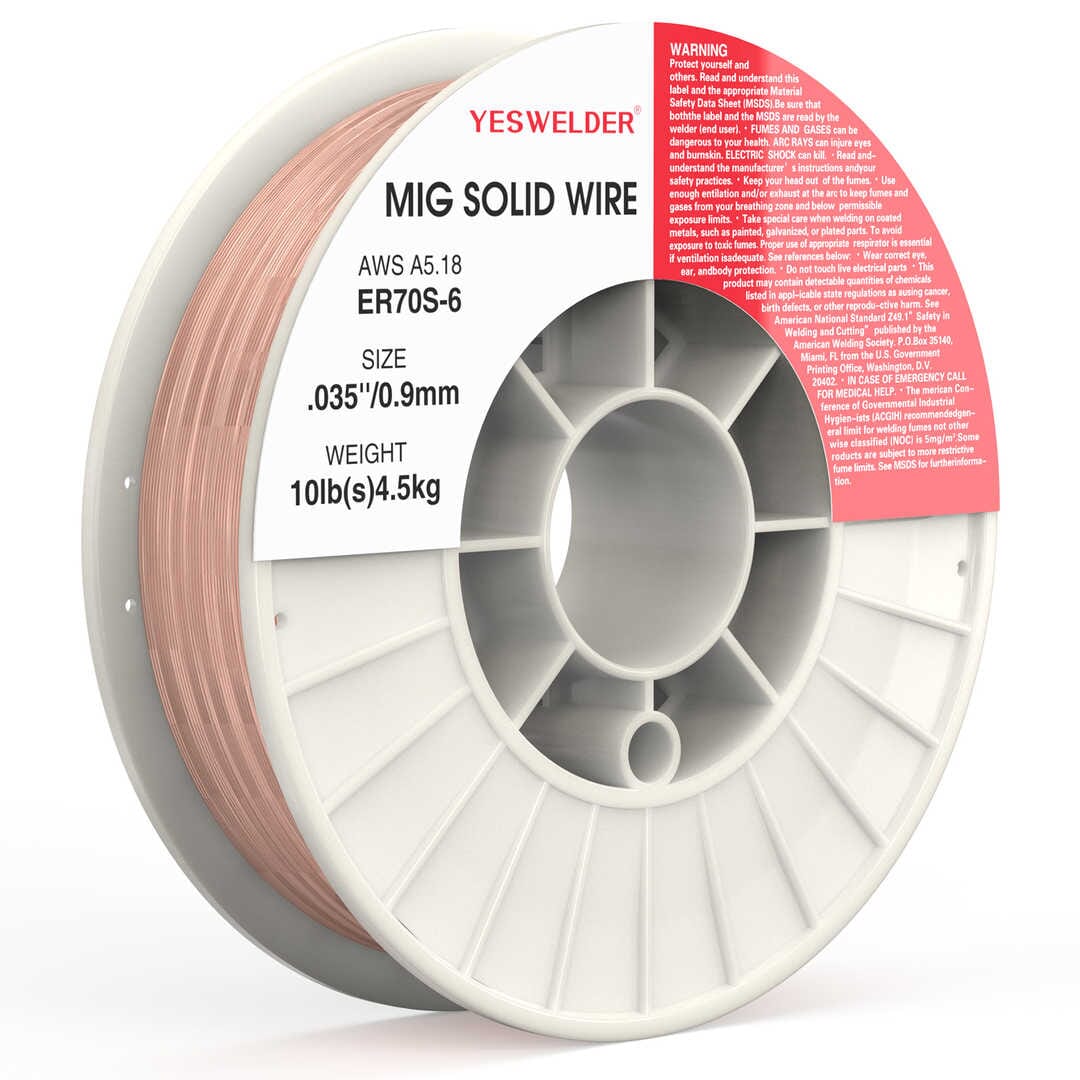
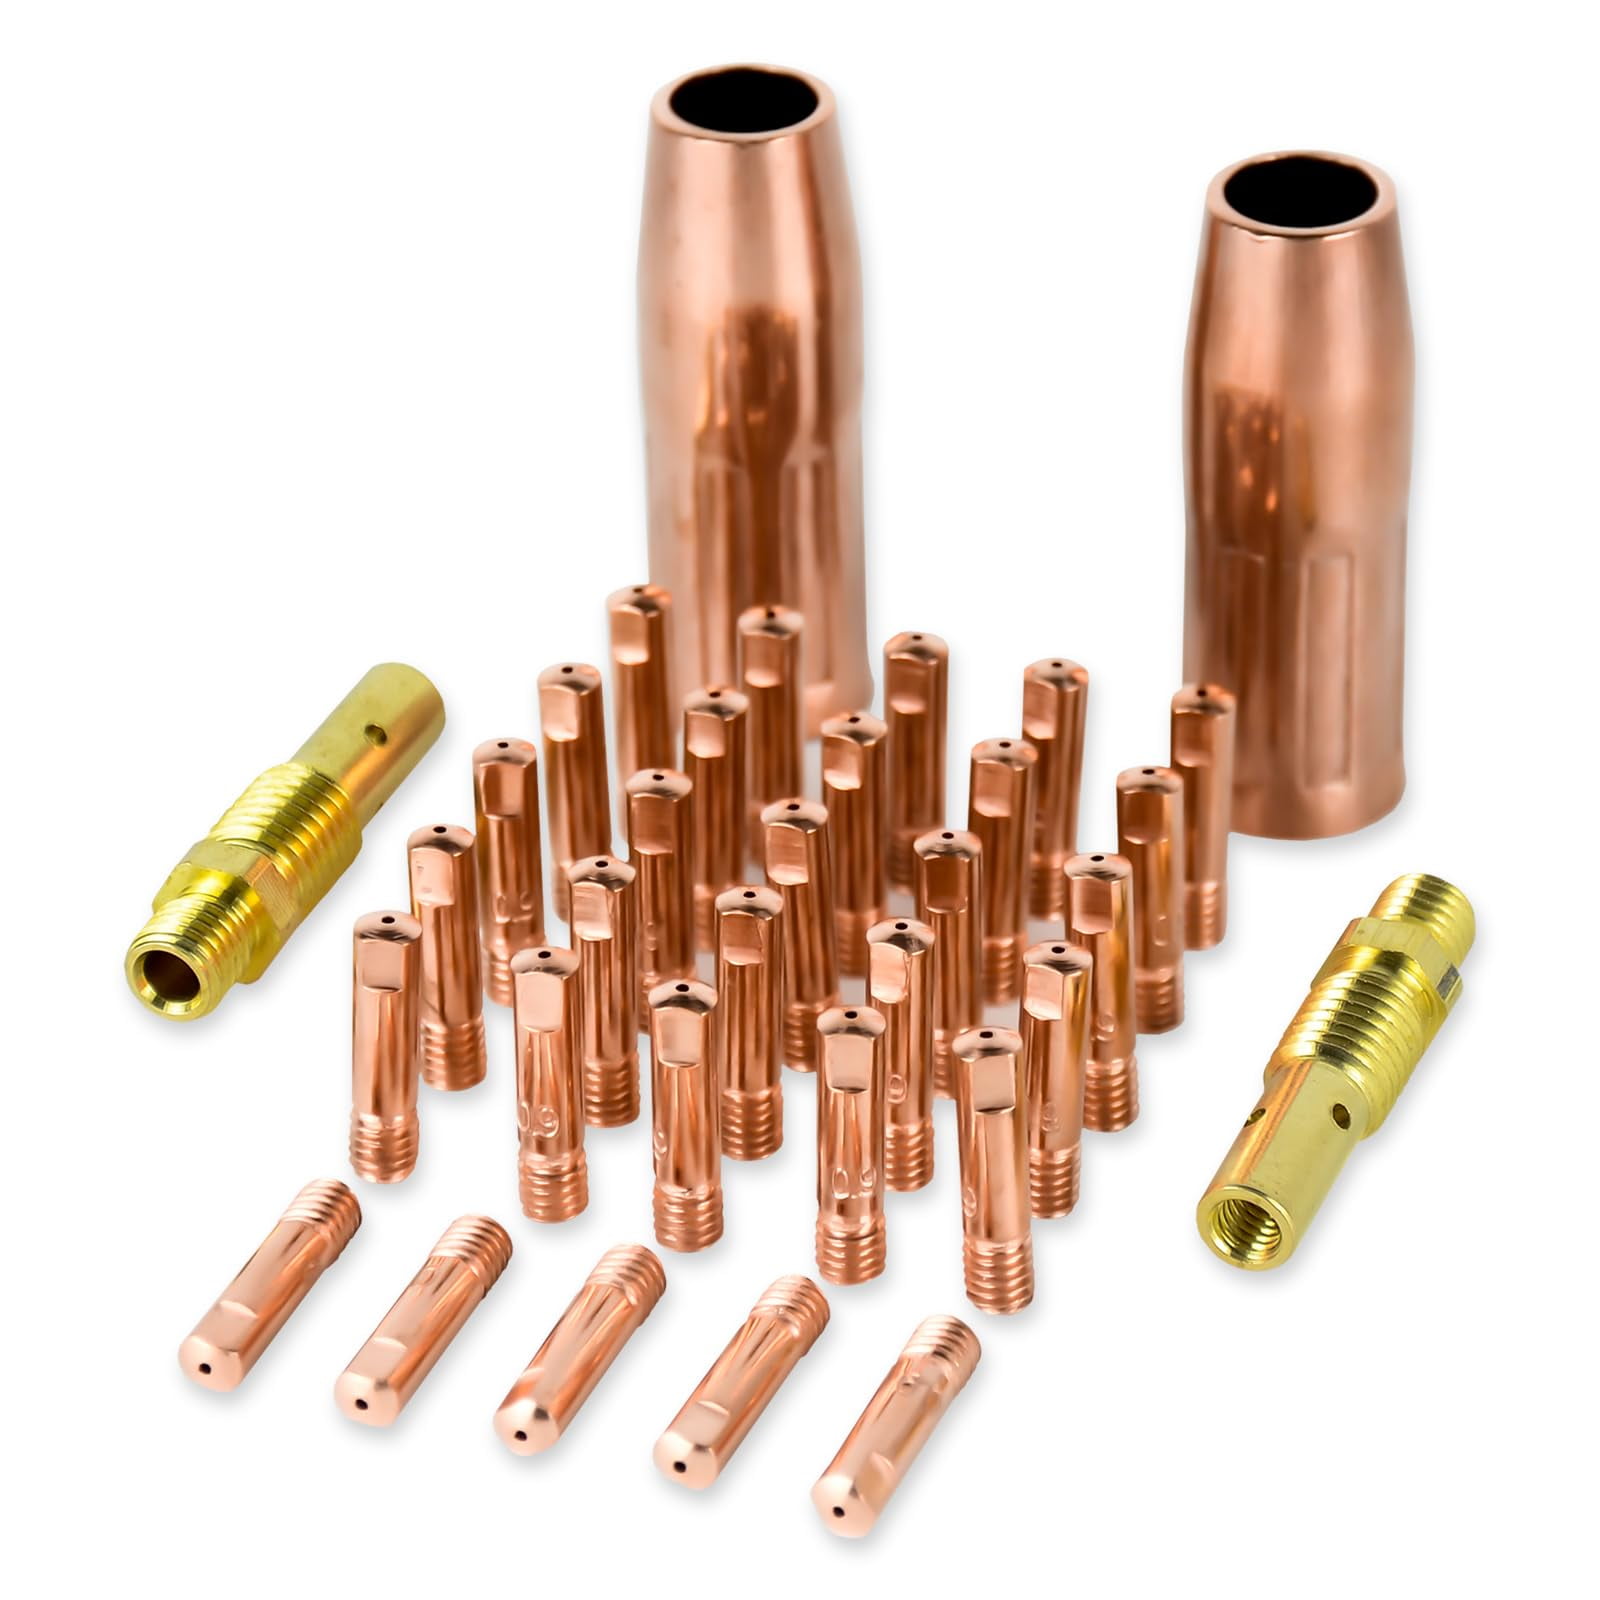
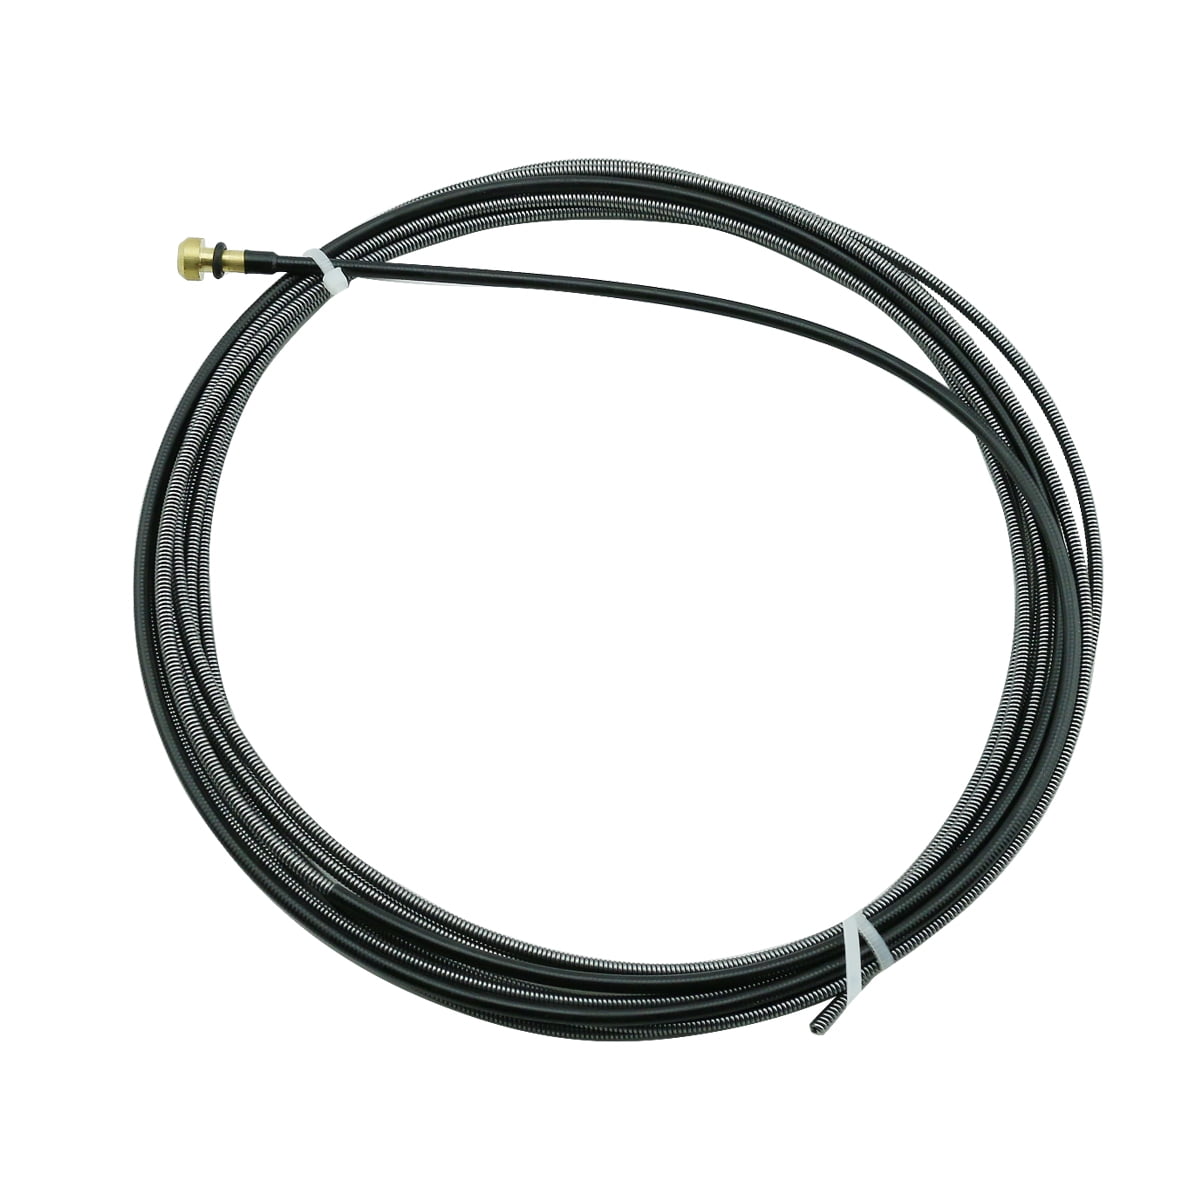
As an Amazon Associate, TestTalkHQ earns from qualifying purchases.
Check melt-off vs deposition, diameter, WFS units, efficiency, and feed slip. Re-run a timed weigh only after the feed path is healthy.
No. That page diagnoses spool overrun and bid filler misses across estimating methods. This page diagnoses why the lbs/hr productivity number itself is wrong.
Only after multiplying by arc-on fraction. Hourly arc rate ≠ pounds per shift.
Convert measured IPM to estimated welding current—or amps back to starting IPM—with the Wire Feed Speed to Amps Calculator. Diameter-specific tables, burn-off factors, voltage pairing, and the six-second feed test are in the Wire Feed Speed Chart Guide.
Calculate wire feet and arc-on hours with the Wire Spool Runtime Calculator, review density and efficiency in the Wire Spool Runtime Guide, then compare changeover labor and inventory risk in 10 lb vs 33 lb Welding Wire Spools.