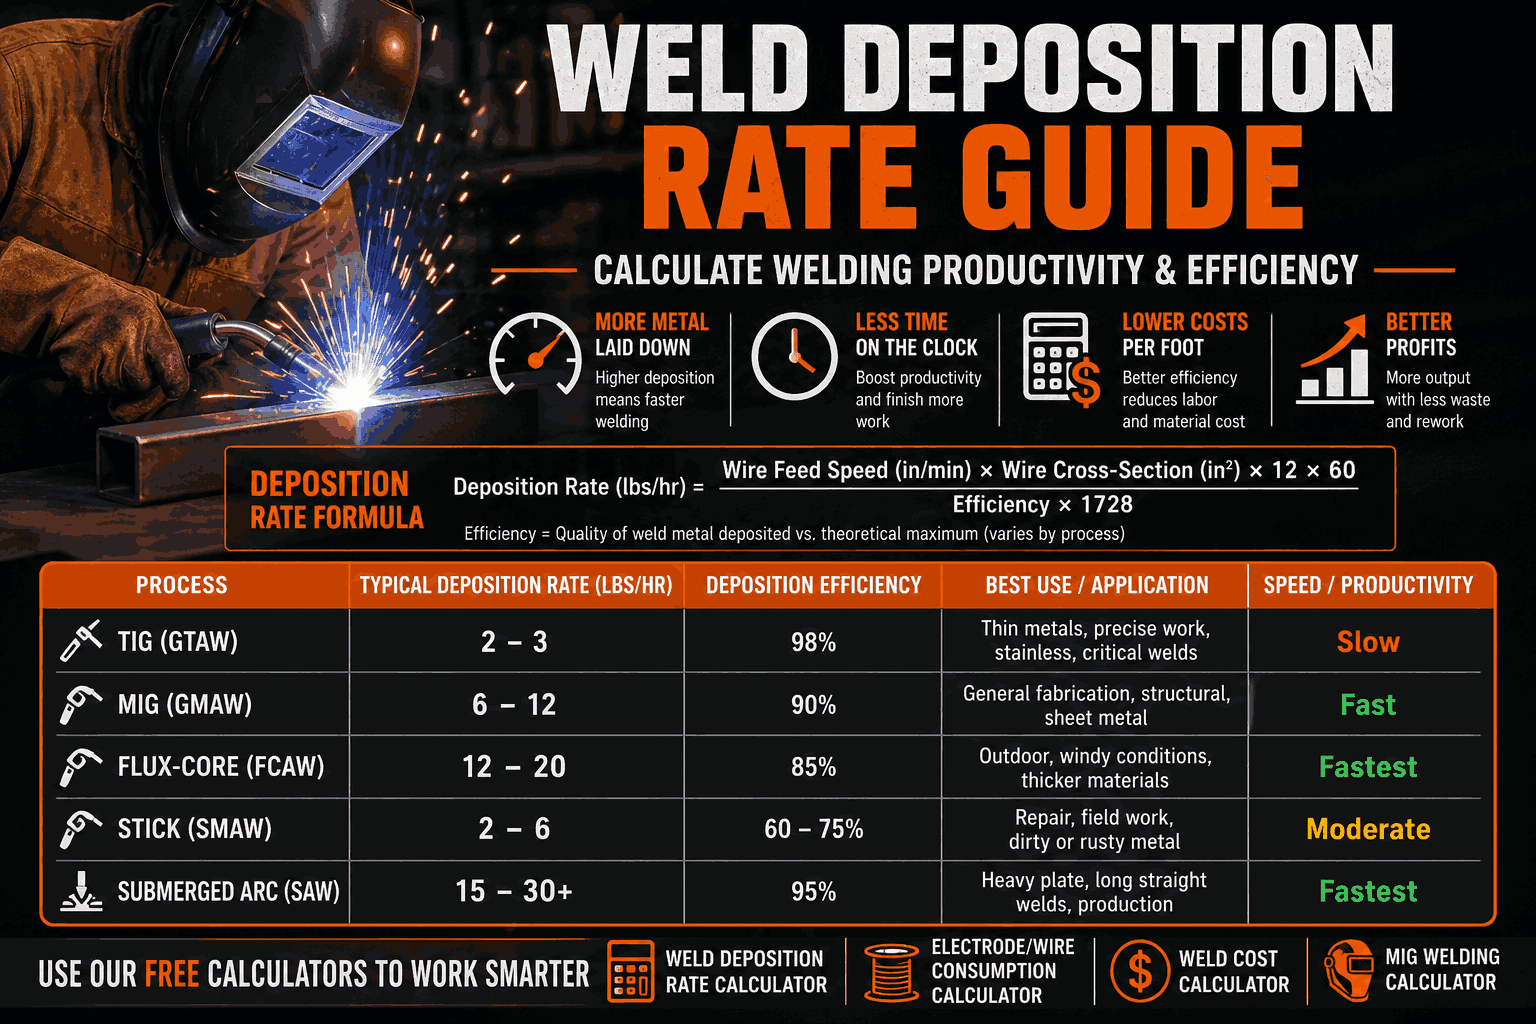
If you cannot state lbs/hr at the arc and your realistic duty cycle, you cannot estimate labor or consumables—you are guessing. This guide ties wire feed, process, and efficiency to pounds deposited per arc hour, then converts that to real shift output. You’re bidding on a structural steel job requiring 200 feet of 1/4″ fillet welds, and the client asks “how long will this take?” Without knowing deposition rate—the pounds of weld metal deposited per hour—you’re just guessing, which is how fabricators either lose money on underpriced jobs or lose bids by overestimating. A MIG welder running .035″ wire at 180 amps deposits approximately 5–6 pounds of weld metal per hour, which means that 200-foot job (requiring roughly 15–18 pounds of wire) takes 3–4 hours of actual arc-on time, not including setup, fit-up, and positioning. Deposition rate determines shop productivity, job profitability, and whether you’re competitive in the market. A shop running 60% efficient (actual arc-on time) with 5 lb/hr deposition completes different work than a shop running 40% efficient with 8 lb/hr deposition—the first deposits 3 lbs per clock hour, the second deposits 3.2 lbs per clock hour, nearly identical despite different deposition rates because operational efficiency matters as much as welding speed. This guide shows you how to calculate deposition rate for MIG, TIG, Stick, and flux-core processes using wire feed speed and amperage, provides complete deposition rate charts by wire size and electrode diameter, and explains how to convert theoretical deposition rates to actual productivity accounting for arc-on time, spatter loss, and stub loss. You’ll learn why MIG short-circuit transfer deposits 3–5 lbs/hr while spray transfer deposits 8–12 lbs/hr on the same material, how increasing wire diameter from .035″ to .045″ increases deposition 40–60%, and the five specific strategies to increase deposition rates 20–40% without sacrificing weld quality. Use our free Weld Deposition Rate Calculator to determine productivity for your specific welding process and settings. When calculator lbs/hr and spool weigh-back disagree, see Weld Deposition Rate Troubleshooting. Estimating-method forks: Which Estimating Method. Ballpark continuous arc rates from the charts below—multiply by your shop’s duty cycle for clock-hour output. Brand, position, and WPS move the window; verify on scrap. For MIG/FCAW, wire feed and diameter dominate the math—use the Weld Deposition Rate Calculator and cross-check wire speed with the wire feed speed guide. Need the numbers, not the lecture? Use the calculators below when you want deposition rate, wire usage, weld cost, or MIG settings without guessing. Deposition rate directly determines how much work a welder can complete per day, which controls labor costs, job profitability, and competitive pricing ability. Real-world example: structural steel fabrication shop Project: Steel building frame, 500 linear feet of 1/4″ fillet welds Scenario A: low deposition rate (4 lbs/hr MIG short-circuit) Scenario B: high deposition rate (8 lbs/hr MIG spray transfer) Difference: $483 saved (53% cost reduction) by using higher deposition process—same job, same material, dramatically different profitability based solely on deposition rate and process selection. Higher deposition rates reduce labor hours proportionally more than they increase consumable costs: Assumes 100% arc-on time for comparison; actual duty cycles vary by process. Key insight: Labor costs dwarf consumable costs. Even when flux-core wire costs ~30% more than solid wire, the labor savings from ~2.5× higher deposition rate makes it far more economical for production work. High priority scenarios: Lower priority scenarios: Deposition rate is the weight of filler metal deposited into the weld per unit of time, typically measured in pounds per hour (lbs/hr) or kilograms per hour (kg/hr). Example: Depositing 6 pounds of weld metal in 1 hour of continuous arc-on time = 6 lbs/hr deposition rate. Critical distinction: Deposition rate measures actual arc-on time, NOT total clock time. A welder working 8 hours with 40% duty cycle (arc-on time) who deposits 4 lbs/hr has: Larger diameter = higher deposition rate at same amperage: Higher amperage = higher wire feed speed = higher deposition: Direct relationship: faster feed = more metal deposited. Theoretical deposition rate: Maximum possible if wire continuously feeds into weld with zero losses. Actual deposition rate: Theoretical × deposition efficiency. Example: .035″ MIG wire @ 150A — theoretical: 6.5 lbs/hr; efficiency (short-circuit): 88%; actual: 6.5 × 0.88 = 5.72 lbs/hr. Use our Wire Consumption Calculator to estimate filler metal requirements accounting for deposition efficiency. Each welding process has specific formulas for calculating deposition rate based on operating parameters. Simplified for mild steel wire: Example: .035″ wire at 300 IPM — plugging the shortcut alone can look absurdly high because 300 IPM is not a realistic pairing for .035″ in normal short-circuit ranges. Use realistic feeds: If your “theoretical” number is double what your machine can run stable, you probably paired the wrong IPM with the wire diameter—measure feed or use the Weld Deposition Rate Calculator. TIG deposition depends on manual filler rod feed rate, making it harder to predict. Typical TIG deposition rates: TIG is intentionally slow for precision work—if deposition rate is priority, TIG is not the optimal process. Or use published charts (more practical than calculating): Same as MIG conceptually, but account for flux core (tubular wire has less metal per diameter): Metal fill factor for flux-core: ~0.75–0.85 (15–25% is flux). Practical approach: use published charts for specific wire brands, as flux formulations vary significantly. MIG welding offers the highest deposition rates of common manual processes, with rates varying dramatically by wire size and transfer mode. Short-circuit transfer (low amperage, thin material): deposition 3–6 lbs/hr (.035″ wire), 80–160A, best for thin/out-of-position; efficiency 85–92%. Spray transfer (high amperage, thick material): deposition 8–15 lbs/hr (.035″ wire), 180–300A, best for thick plate flat/horizontal production; efficiency 95–98%. Pulse transfer (variable amperage): deposition 6–10 lbs/hr (.035″ wire), 120–220A pulsing, best for all-position aluminum/stainless; efficiency 90–95%. Calculate optimal MIG settings with our MIG Welding Calculator. TIG welding has the lowest deposition rates of common arc welding processes because filler metal is added manually, not continuously fed. Manual filler rod addition: welder physically dips rod into puddle, limiting speed to hand-eye coordination. Precision over speed: TIG is chosen for quality, not productivity—root passes on pipe, aluminum, thin stainless, critical applications. Actual productivity impact: TIG often takes 2–5× longer than MIG for equivalent weld volume, but produces superior quality with minimal cleanup. Hot wire TIG preheats filler wire with electrical resistance before adding to puddle, dramatically increasing deposition: manual 2–3 lbs/hr vs hot wire 8–15 lbs/hr (~4–5×). Hot wire systems are automated/mechanized, not a drop-in for every manual bench job. Calculate TIG settings with our TIG Welding Calculator. Stick welding deposition rates fall between TIG and MIG, with significant losses from slag coating and electrode stub. Stick electrodes have two major sources of loss: (1) Slag coating (30–40% of electrode weight)—slag weight doesn’t become weld metal; E7018 ~35% coating / 65% core. (2) Stub loss (1–2″ remaining)—can’t burn completely; ~10–11% waste on a 14″ rod with 1.5″ stub. Combined efficiency: core wire 65%, stub −10% → net ~58–60% for E6010, 62–68% for E7018. Calculate stick welding settings with our Stick Welding Calculator. Flux-cored wire offers the highest deposition rates of common welding processes, particularly in flat/horizontal positions. Self-shielded (FCAW-S): no external gas; moderate deposition 4–10 lbs/hr typical; outdoor tolerant; more spatter; efficiency 78–85%. Gas-shielded (FCAW-G): CO₂ or 75/25; high deposition 8–28 lbs/hr; cleaner; best for structural production; efficiency 82–88%. Flux-core dominates where deposition rate is critical: structural erection, shipbuilding, bridge work, heavy equipment. A skilled welder with 1/16″ gas-shielded flux-core can deposit ~15–18 lbs/hr—often 3–4× faster than .035″ solid MIG on the same operator for long fillets. These charts provide quick reference for deposition rates across all major processes. Deposition rates in lbs/hr; — indicates outside practical amperage range for wire size. Theoretical deposition rates assume 100% arc-on time and perfect efficiency. Real-world productivity is significantly lower. Typical duty cycles by shop type: Example: MIG welder with 8 lbs/hr deposition, 40% duty cycle → 8 × 0.40 = 3.2 lbs per clock hour. In an 8-hour day: theoretical 100% arc-on = 64 lbs; actual at 40% = 25.6 lbs deposited. Calculate total wire/electrode consumption with our Filler Metal Weight Calculator. Professional shops implement these strategies to increase deposition rates 20–40% without sacrificing quality. Use largest practical wire size for material thickness. Example: 1/4″ plate — .035″ @ 160A ~6.5 lbs/hr vs .045″ @ 180A ~10.5 lbs/hr (~62% higher). Stock multiple sizes; change tips when switching thickness bands. On thick flat/horizontal work, spray can roughly double or triple short-circuit deposition—but requires thickness (often ≥3/16″), position, and appropriate Ar/CO₂ mix (not straight CO₂ for many setups). Example: .035″ solid ~6.5 lbs/hr vs .045″ flux-core ~10–12 lbs/hr on structural flat work. Trade-offs: spatter, slag, higher wire $/lb—labor savings usually dominate. Stringers vs weave, fewer restarts, better joint prep, pre-position to flat/horizontal, batch similar setups. Poor organization ~25–30% duty vs optimized 40–50% duty = 35–67% more metal per day at the same parameters. Example vertical-up 3/16″: short-circuit ~4.5 lbs/hr vs pulse ~6.5–7.5 lbs/hr. Needs pulse-capable machine, correct gas mix, and trained technique. Accurate job estimation requires converting deposition rates to actual hours and costs. Example job: structural steel brackets (20 pieces). Each bracket: 24″ of 1/4″ fillet → 20 × 24″ = 480″ = 40 ft. Weld metal: ~0.075 lbs/ft for 1/4″ fillet → 40 × 0.075 = 3 lbs. Process: MIG .035″ spray @ 9 lbs/hr → arc-on = 3 ÷ 9 = 0.33 hr (~20 min). Duty cycle 40% → 20 min ÷ 0.40 = 50 min clock. Roll labor, wire, gas, overhead, then markup—same math the Weld Cost Calculator is built to support. Calculate total job costs with our Weld Cost Calculator. “Good” depends on application: TIG ~2–3 lbs/hr (precision), MIG short-circuit ~4–6 lbs/hr (general fab), MIG spray ~8–12 lbs/hr (thick production), flux-core ~12–18 lbs/hr (structural production). Higher isn’t always better—match thickness and WPS. Use our Deposition Rate Calculator for your settings. Divide pounds deposited by arc-on hours. For MIG/flux-core, wire feed × diameter² × ~2.25 (mild steel shortcut) gives a theoretical starting point; multiply by efficiency for actual. Charts beat hand math for stick/TIG where technique dominates. Among common manual/semi-auto processes, gas-shielded flux-core often leads (~12–28 lbs/hr by wire size). SAW can exceed that (~20–60+ lbs/hr) but needs automation. Ranking is only useful with position, thickness, and quality constraints applied. Larger diameter feeds more cross-section per inch—relationship scales roughly with diameter squared. .035″ to .045″ is often ~40–60% more deposition in comparable amp bands, but raises minimum heat and thickness requirements. Percentage of purchased filler that becomes weld metal vs spatter, slag, stubs. MIG spray 95–98%, short-circuit 85–92%, flux-core 80–88%, E7018 ~62–68%, TIG 95–99%. Order consumables using efficiency, not ideal deposited weight alone. Labor is typically 60–75% of welding cost—doubling effective deposition halves arc hours. Consumable deltas are usually smaller than labor saved when stepping up processes legitimately. Percent of clock time with arc actually on. 8 lbs/hr × 30% duty = 2.4 lbs/clock hr; same welder at 45% duty = 3.6 lbs/clock hr (+50% output) without touching amps. Yes—often ~2–3× more metal per hour in the thick-flat regime spray is designed for. Not interchangeable for all joints. Larger wire when allowed, higher-deposition process when WPS allows, better duty cycle via fixtures and flow, technique (stringers, fewer stops), pulse for some out-of-position work. Stack levers instead of chasing one knob. Divide required deposited pounds by available arc hours (clock hours × duty cycle). If the required lbs/hr exceeds what your allowed process can sustain, you extend calendar time or change process—not wishful thinking. Hand-fed filler and heat control cap how many pounds enter the joint per hour even when the arc is “hot.” TIG trades speed for control and cleanliness. For continuous wire processes, more IPM (with stable arc) generally means more metal per minute—until you outrun heat balance, position, or fusion requirements. No—if you drive heat input too high for thin sections, cause rework, or spend hours fixing fit-up, clock-time productivity drops. Deposition is one variable in a system. Estimate deposited weight, pick realistic lbs/hr at the arc for the WPS, divide for arc hours, then divide by expected duty cycle for clock hours. Cross-check with shop history on similar joints. Weld deposition rate determines whether shops are profitable or barely breaking even because labor costs (60–75% of total welding costs) track closely with how fast good weld metal goes in. The lever is rarely “weld frantically”—it’s process + diameter + transfer mode + duty cycle chosen to match the job. Key takeaways: For hobby work, flexible timelines hide weak estimates. For professional shops, deposition math is margin math. Also useful: Filler Metal Weight Calculator · TIG Welding Calculator · Stick Welding Calculator Have questions about weld deposition rates or job estimation? Drop a comment below or reach out—we’re here to help!
Electrode/Wire Consumption Calculator
Weld Cost Calculator
MIG Welding Calculator
Weld Deposition Rate Quick Answer
Process
Typical deposition rate
Efficiency
Best use
Watch out for
Stick / SMAW
~2.5–5.5 lb/hr (E7018 1/8″ band)
58–68%
Field, repairs, all-position
Stub loss + slag—not every pound bought becomes weld metal
MIG solid / GMAW
Short-circuit ~3–6; spray ~8–15 lb/hr (.035″)
85–98%
Shop fab, thick plate production
Spray needs thickness + position + gas mix—can’t spray everything
Flux-core / FCAW
Self-shield ~4–10; gas-shield ~10–28 lb/hr
80–88%
Structural, ship, long linear welds
Slag + spatter cleanup—labor still wins if you run the right process
TIG / GTAW
Manual ~1.5–3 lb/hr (Al often a bit higher)
95–99%
Code roots, stainless, thin, appearance-critical
Hand-fed filler caps throughput—fine for quality, slow for pounds
Submerged arc / SAW
~15–45+ lb/hr (60+ possible automated)
Very high (automated)
Long seams, heavy plate automation
Setup, flux handling, automation—not a hand-gun replacement

Why Deposition Rate Matters
The Business Impact of Deposition Rate
Deposition Rate vs. Hourly Labor Cost
Process
Deposition rate
Hours for 40 lbs
Labor @ $35/hr
Consumables
Total
TIG (manual)
2 lbs/hr
20 hrs
$700
$120
$820
Stick (E7018)
3.5 lbs/hr
11.4 hrs
$399
$140
$539
MIG short-circuit
4.5 lbs/hr
8.9 hrs
$312
$120
$432
MIG spray transfer
8 lbs/hr
5 hrs
$175
$120
$295
Flux-core (production)
12 lbs/hr
3.3 hrs
$116
$160
$276
When Deposition Rate Matters Most
What is Weld Deposition Rate?
Deposition Rate Definition
Factors Affecting Deposition Rate
1. Wire/electrode diameter
2. Amperage/current
3. Wire feed speed (MIG/flux-core)
4. Transfer mode (MIG)
5. Deposition efficiency (% of electrode that becomes weld metal)
Theoretical vs. Actual Deposition Rate
Deposition Rate Formulas by Process
MIG/GMAW Deposition Rate Formula
Sanity-check the shortcut
TIG/GTAW Deposition Rate Formula
Stick/SMAW Deposition Rate Formula
Electrode size
Amperage
Deposition rate (lbs/hr)
3/32″ (E7018)
90–120A
1.5–2.5
1/8″ (E7018)
110–165A
2.5–4.0
5/32″ (E7018)
140–220A
3.5–5.5
3/16″ (E7018)
180–275A
4.5–7.0
Flux-Core/FCAW Deposition Rate Formula
MIG Deposition Rates (GMAW)
MIG Deposition by Wire Size
Wire size
Amperage range
Wire feed speed
Deposition rate (lbs/hr)
.023″
40–90A
200–500 IPM
1.5–3.5
.030″
60–145A
150–450 IPM
2.5–6.0
.035″
80–180A
150–500 IPM
3.5–9.5
.045″
120–250A
150–450 IPM
6.0–14.0
.052″
150–300A
150–400 IPM
8.0–16.0
MIG Transfer Mode Comparison
Increasing MIG Deposition Rate
TIG Deposition Rates (GTAW)
Manual TIG Deposition Rates
Material
Filler rod size
Typical deposition (lbs/hr)
Mild steel
1/16″–3/32″
1.5–3.0
Stainless steel
1/16″–3/32″
1.5–2.5
Aluminum
1/16″–1/8″
2.0–4.0
Titanium
1/16″–3/32″
1.0–2.0
Why TIG is Slow
Automated TIG (Hot Wire GTAW)
Stick Deposition Rates (SMAW)
Stick Electrode Deposition Rates
Electrode
Diameter
Amperage
Deposition (lbs/hr)
Efficiency
E6010
1/8″
90–140A
1.5–2.5
58–62%
E7018
1/8″
110–165A
2.5–4.0
62–68%
E7018
5/32″
140–220A
3.5–5.5
62–68%
E7024
5/32″
160–240A
5.0–8.0
68–72%
E7018
3/16″
180–275A
4.5–7.0
62–68%
Deposition Efficiency: Why Stick is Lower
High-Deposition Stick Electrodes
Flux-Core Deposition Rates (FCAW)
Flux-Core Deposition by Wire Size
Wire size
Type
Amperage
Deposition (lbs/hr)
.035″
Self-shielded
80–150A
3.0–6.0
.045″
Self-shielded
130–200A
6.0–10.0
.045″
Gas-shielded
150–250A
8.0–14.0
1/16″
Gas-shielded
200–350A
12.0–20.0
5/64″
Gas-shielded
250–450A
15.0–28.0
Self-Shielded vs. Gas-Shielded Flux-Core
Why Flux-Core Has Highest Deposition
Production Flux-Core Applications
Complete Deposition Rate Charts
Deposition Rate Comparison by Process
Process
Typical range (lbs/hr)
Maximum (lbs/hr)
Best application
TIG (manual)
1.5–3.0
4.0
Precision, thin material
Stick (E7018)
2.5–5.5
7.0
Field work, all-position
MIG short-circuit
3.0–6.0
8.0
Thin material, out-of-position
MIG spray transfer
8.0–12.0
16.0
Thick plate, flat position
Flux-core (self-shielded)
4.0–10.0
14.0
Outdoor, structural
Flux-core (gas-shielded)
10.0–20.0
28.0
Production welding
Submerged arc (SAW)
15.0–45.0
60.0+
Automated production
Wire Diameter vs. Deposition Rate (MIG)
Wire size
@ 100A
@ 150A
@ 200A
.030″
3.0
5.5
—
.035″
3.5
6.5
9.5
.045″
5.0
8.5
12.0
.052″
—
10.0
14.0
Actual vs. Theoretical Deposition
Duty Cycle (Arc-On Time Percentage)
Actual Productivity Calculation
Deposition Efficiency Losses
Process
Deposition efficiency
Loss sources
TIG
95–99%
Minimal (virtually no waste)
MIG spray
95–98%
Minimal spatter
MIG short-circuit
85–92%
Moderate spatter
Flux-core
80–88%
Spatter + slag
Stick (E7018)
62–68%
Slag + stub loss
Stick (E6010)
58–62%
Slag + stub loss + spatter
5 Ways to Increase Deposition Rates
1. Switch to larger wire/electrode diameter (+40–60%)
2. Switch to spray transfer (MIG) (+100–150%)
3. Switch to flux-core wire (+50–100%)
4. Optimize welding technique (+20–30%)
5. Use pulsed MIG out-of-position (+30–50%)
Using Deposition Rates for Job Estimation
Step-by-Step Job Estimation
Common estimation mistakes
Frequently Asked Questions
What is a good weld deposition rate?
How do you calculate weld deposition rate?
What welding process has the highest deposition rate?
How does wire size affect deposition rate?
What is deposition efficiency in welding?
How much does deposition rate affect job cost?
What is duty cycle and how does it affect productivity?
Is MIG spray transfer faster than short-circuit?
How do I increase welding productivity?
What deposition rate do I need for my job?
Why is TIG slower than MIG or flux-core?
How does wire feed speed affect deposition rate?
Does higher deposition always mean better productivity?
How do I estimate welding labor time?
Conclusion: Deposition Rate Drives Shop Profitability
Electrode/Wire Consumption Calculator
Weld Cost Calculator
MIG Welding Calculator
Deposition rate tells lbs/hr; if purchased wire still overruns the bid, diagnose with Wire Consumption Troubleshooting.
Welding
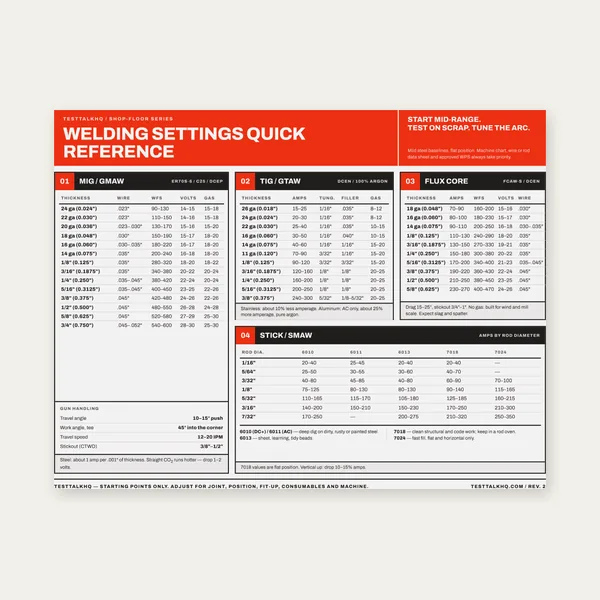
Welding Reference Card
One page. MIG, TIG, stick and flux core settings by thickness.
$3.99
Buy
Complete Welding Settings Guide
19 pages. Four processes, stainless and aluminum, symbols and inspection.
$12.99
Buy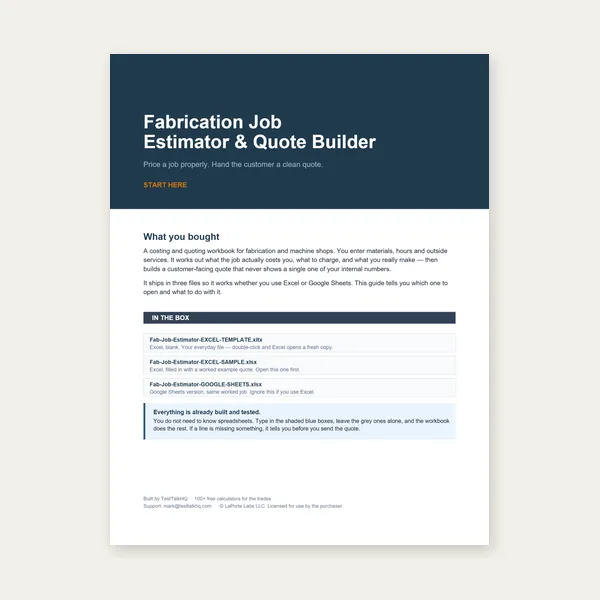
Welding Job Estimator
Price the job, then hand over a quote with no internal numbers.
Excel or Google Sheets. Best on a computer.
$29.00
Buy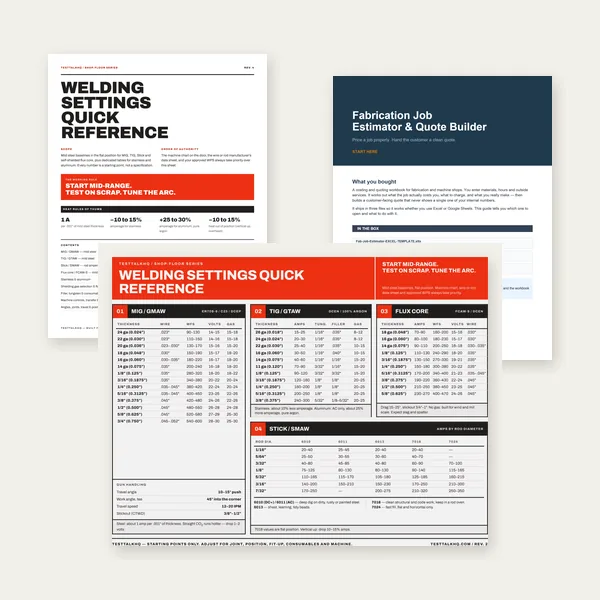
Welding Complete Bundle
Card, 19-page guide and the estimator workbook. All six files.
Excel or Google Sheets. Best on a computer.
$34.99
$45.98 if bought separately — save $10.99
BuyCheckout opens in a new tab.