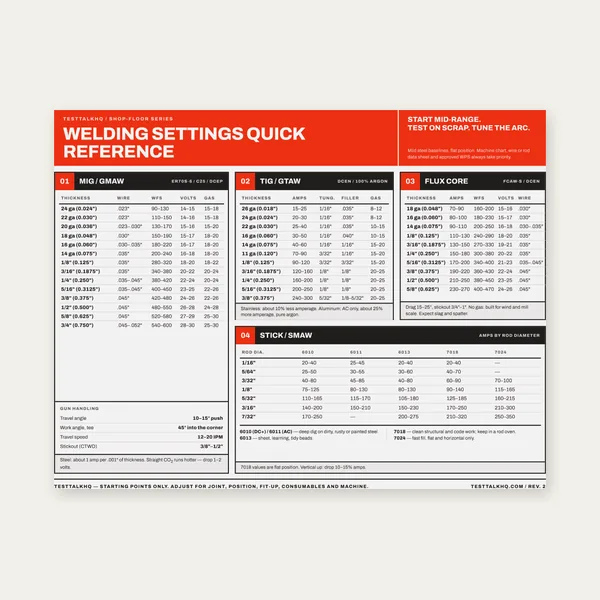
Welding Reference Card
One page. MIG, TIG, stick and flux core settings by thickness.
$3.99
BuyDiagnose when calculator results fight labels or studies: stale assessments, wrong fault/clearing inputs, working-distance mistakes, PPE category mismatches, and NFPA 70E table vs IEEE 1584 methodology gaps
Not another “what is an arc flash boundary” explainer — that lives in the Arc Flash Boundary Guide. Category clothing lists live on the PPE Category Chart. Use the Arc Flash Boundary Calculator for what-if estimates, then use this page when numbers disagree. For the method fork, see Table Method vs Incident Energy Analysis.
| Problem | What it usually means | First fix | Next tool |
|---|---|---|---|
| Calc IE ≠ label / study | Stale study, gear changed, or calc used different fault/clearing assumptions | Compare study date, fuse/breaker types, and bolted fault source to today’s equipment | Short-Circuit Calculator |
| AFB looks huge / tiny for equipment class | Wrong working distance, voltage class, or transformer Z / available fault | Re-enter WD the task actually uses; verify kA from utility/study not a guess | AFB Calculator |
| PPE category fights calculated cal/cm² | Rounding down, mixing table Cat with IE label, or ignoring ATPV ≥ IE | If label shows IE, dress to IE — do not drop a category for comfort | PPE Chart |
| Field label ≠ site calculator | IEEE 1584 study vs simplified Lee / Annex-style estimate — different models | Trust the stamped study/label for work; use calc for training / clearing-time what-ifs only | Method Decision |
| Silent wrong inputs | Bolted vs arcing confusion, cycles vs seconds, default 18" WD left in | Audit units and every default before trusting the green result | Boundary Guide |
What it looks like: The calculator prints 4 cal/cm² while the sticker says 12, or vice versa. Workers argue about which PPE to wear.
Why it happens: Simplified calculators and engineering studies are not the same model. Even when both claim “IEEE-ish” math, inputs differ: available bolted fault current, arcing current equations, enclosure factors, and protective-device clearing curves. The most common field cause is a study that aged — equipment changed, sticker did not.
Likely causes:
How to fix it: Pull the study one-line and device TCC, not tribal memory. Re-enter the study’s published bolted fault and clearing time. If gear changed, schedule a study update — do not “fix” a stale label with a website estimate.
What it looks like: A 480 V lighting panel shows a 20-foot AFB, or a big switchgear lineup shows a suspiciously small boundary. Instinct says “that can’t be right.”
Why it happens: AFB is driven by incident energy and distance — not by “how scary the gear looks.” Misapplied working distance, wrong voltage class, and transformer impedance / available fault errors move AFB hard. Long clearing times balloon energy and therefore boundary radius.
Likely causes:
How to fix it: Reconcile bolted fault with the short-circuit calculator / study. Fix units. Set working distance to the documented task distance, not a hopeful “I’ll stand back.”
What it looks like: Calc shows ~9 cal/cm²; someone grabs Cat 1 (4 cal) clothing because “it’s only a quick look.” Or a label shows 12 cal/cm² and the crew wears Cat 2 because the chart’s “typical” row felt close enough.
Why it happens: Categories are a table-method construct. Incident energy analysis expects clothing ATPV/EBT ≥ calculated IE at the working distance. Mixing the two systems — or rounding down — is a common real-world failure.
How to fix it:
Category overview (not diagnosis): PPE Category Chart.
What it looks like: Qualified person runs a planning calculator on a phone; it disagrees with the sticker. Debate starts in front of an open panel.
Why it happens: Site labels from an IEEE 1584-based study include equipment-specific factors a simplified Lee / Annex D educational calculator does not. Methodology, arcing current iteration, and enclosure correction differ. A website tool is for orientation and clearing-time what-ifs — not for overriding a stamped assessment.
How to decide:
Method choice (table vs analysis): Table Method vs Incident Energy Analysis.
One page. MIG, TIG, stick and flux core settings by thickness.
$3.99
Buy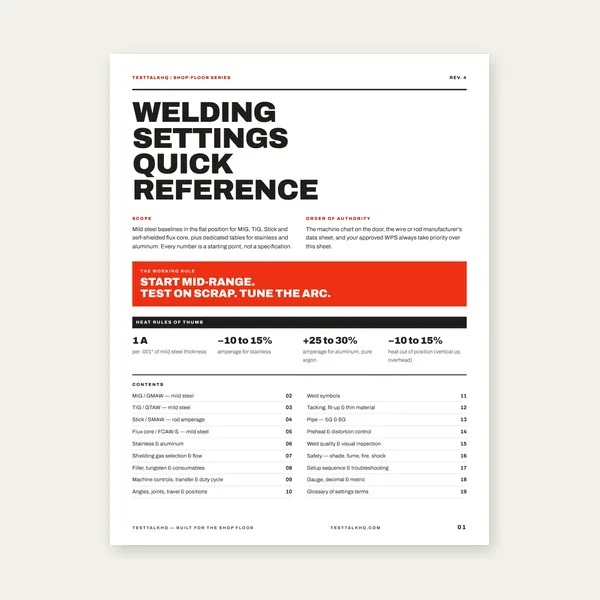
19 pages. Four processes, stainless and aluminum, symbols and inspection.
$12.99
Buy
Price the job, then hand over a quote with no internal numbers.
Excel or Google Sheets. Best on a computer.
$29.00
Buy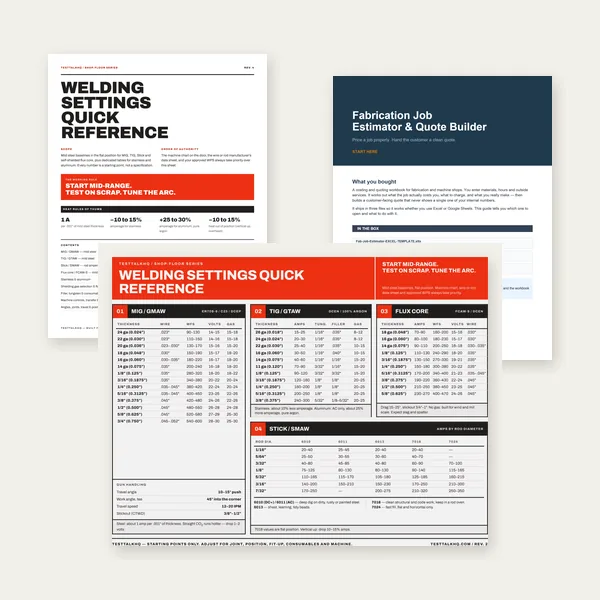
Card, 19-page guide and the estimator workbook. All six files.
Excel or Google Sheets. Best on a computer.
$34.99
$45.98 if bought separately — save $10.99
BuyCheckout opens in a new tab.
Six Electrical / Safety picks from the TestTalkHQ affiliate CSV — meters, insulated tools, NCVT, and PPE for energized-work verification


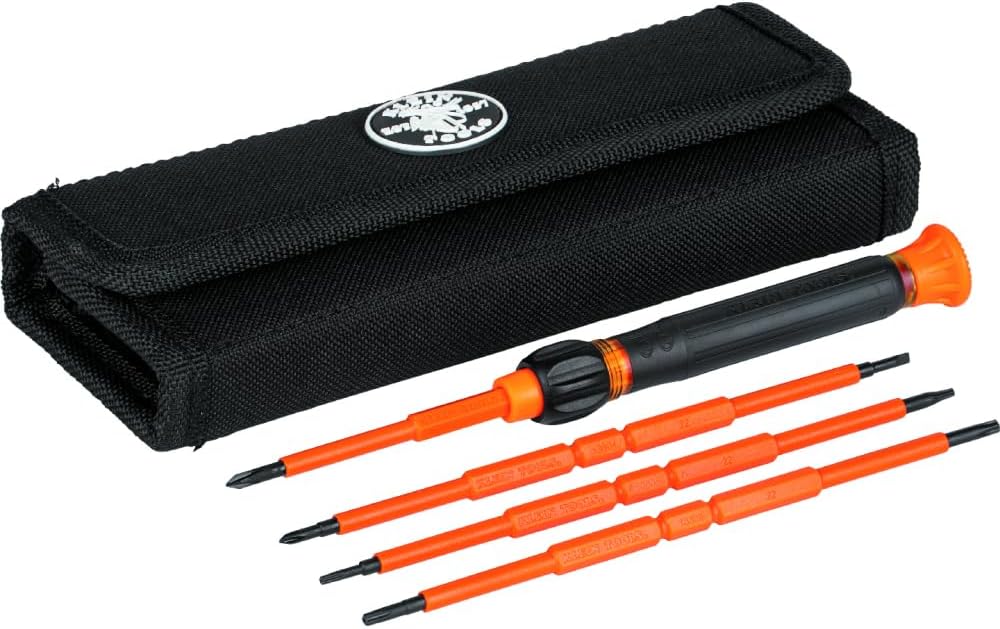

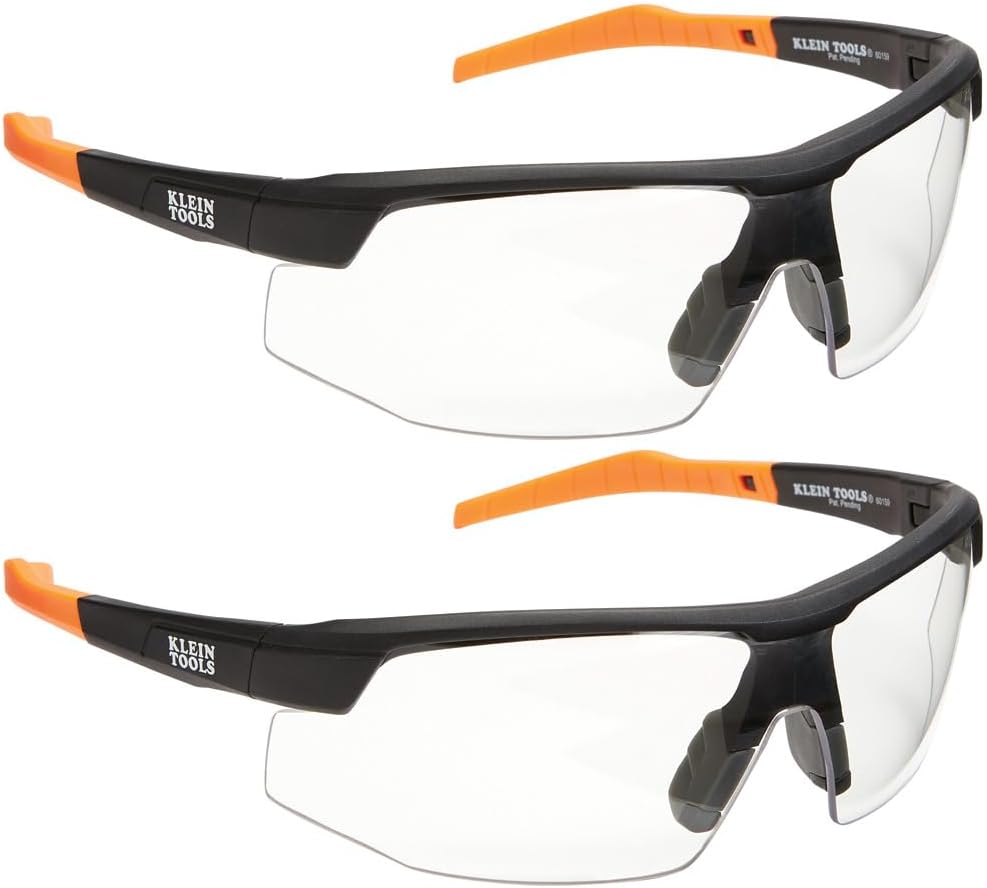
As an Amazon Associate, TestTalkHQ earns from qualifying purchases. Catalog products only — educational PPE planning, not a substitute for employer-specified AR clothing systems.
No. Averaging is not an engineering control. Follow the assessment/label or get it updated.
Energy integrates power over time. Slow clearing multiplies incident energy and expands the AFB. That is why device changes obsolete stickers.
Treat site tools as educational simplified estimates. IEEE 1584 studies are performed by qualified engineers with full system models.
Shock limited/restricted/prohibited boundaries are separate from AFB. See the boundary guide.